
Hello, my name is Daniel
I am a
If you have data and need to make sense of it, I can help. I specialize in machine learning, data analysis, and visualization to uncover stories hidden in numbers and data.
More about MeAbout Me

Hi, I'm Daniel Tshiani. I am based in Baltimore, Maryland.
If you have data and need to make sense of it, I can help. I focus on turning messy data into clear, actionable insights. My work spans data mining, modeling, natural language processing, and machine learning to build solutions that help people and organizations make better decisions. Whether it’s developing predictive models or creating interactive dashboards, my goal is to make data easy to understand and use. I am currently completing my Master’s in Data Science at American University and graduating in December 2025. I serve as a Teaching Assistant, helping students master key concepts in data science. I am also serving as a Data Visualization Specialist at RIPIL. Take a look at my portfolio to see what i've been working on.
Experience
2 + YearsCompleted
10 + ProjectsSupport status
Currently accepting new workEducation
American University
Master of Science in Data Science
Loyola University
Bachelor of Science in Economics and Mathematics
Montgomery College
Associate of Science in Mathematics
Tech Stack
Programming Languages
- Python
- R
- STATA
- SQL
- HTML
- CSS
- JavaScript
Machine Learning & AI
- Supervised Learning (Regression, Classification, Decision Trees / Random Forests, Lasso, SVM)
- Unsupervised Learning (Clustering, PCA)
- Deep Learning,
- GANs
- GNNs
- Tensor/Matrix Factorization
Knowledge Areas
- Computer Vision
- NLP
- Data Analysis
- Statistical Methods (Discriminant Analaysis, Splines, Bootstrap)
Data Visualization
- Tableau
- Power BI
Tools and Technologies
- Git & GitHub
- Excel
Languages
- English
- French
Recent Works
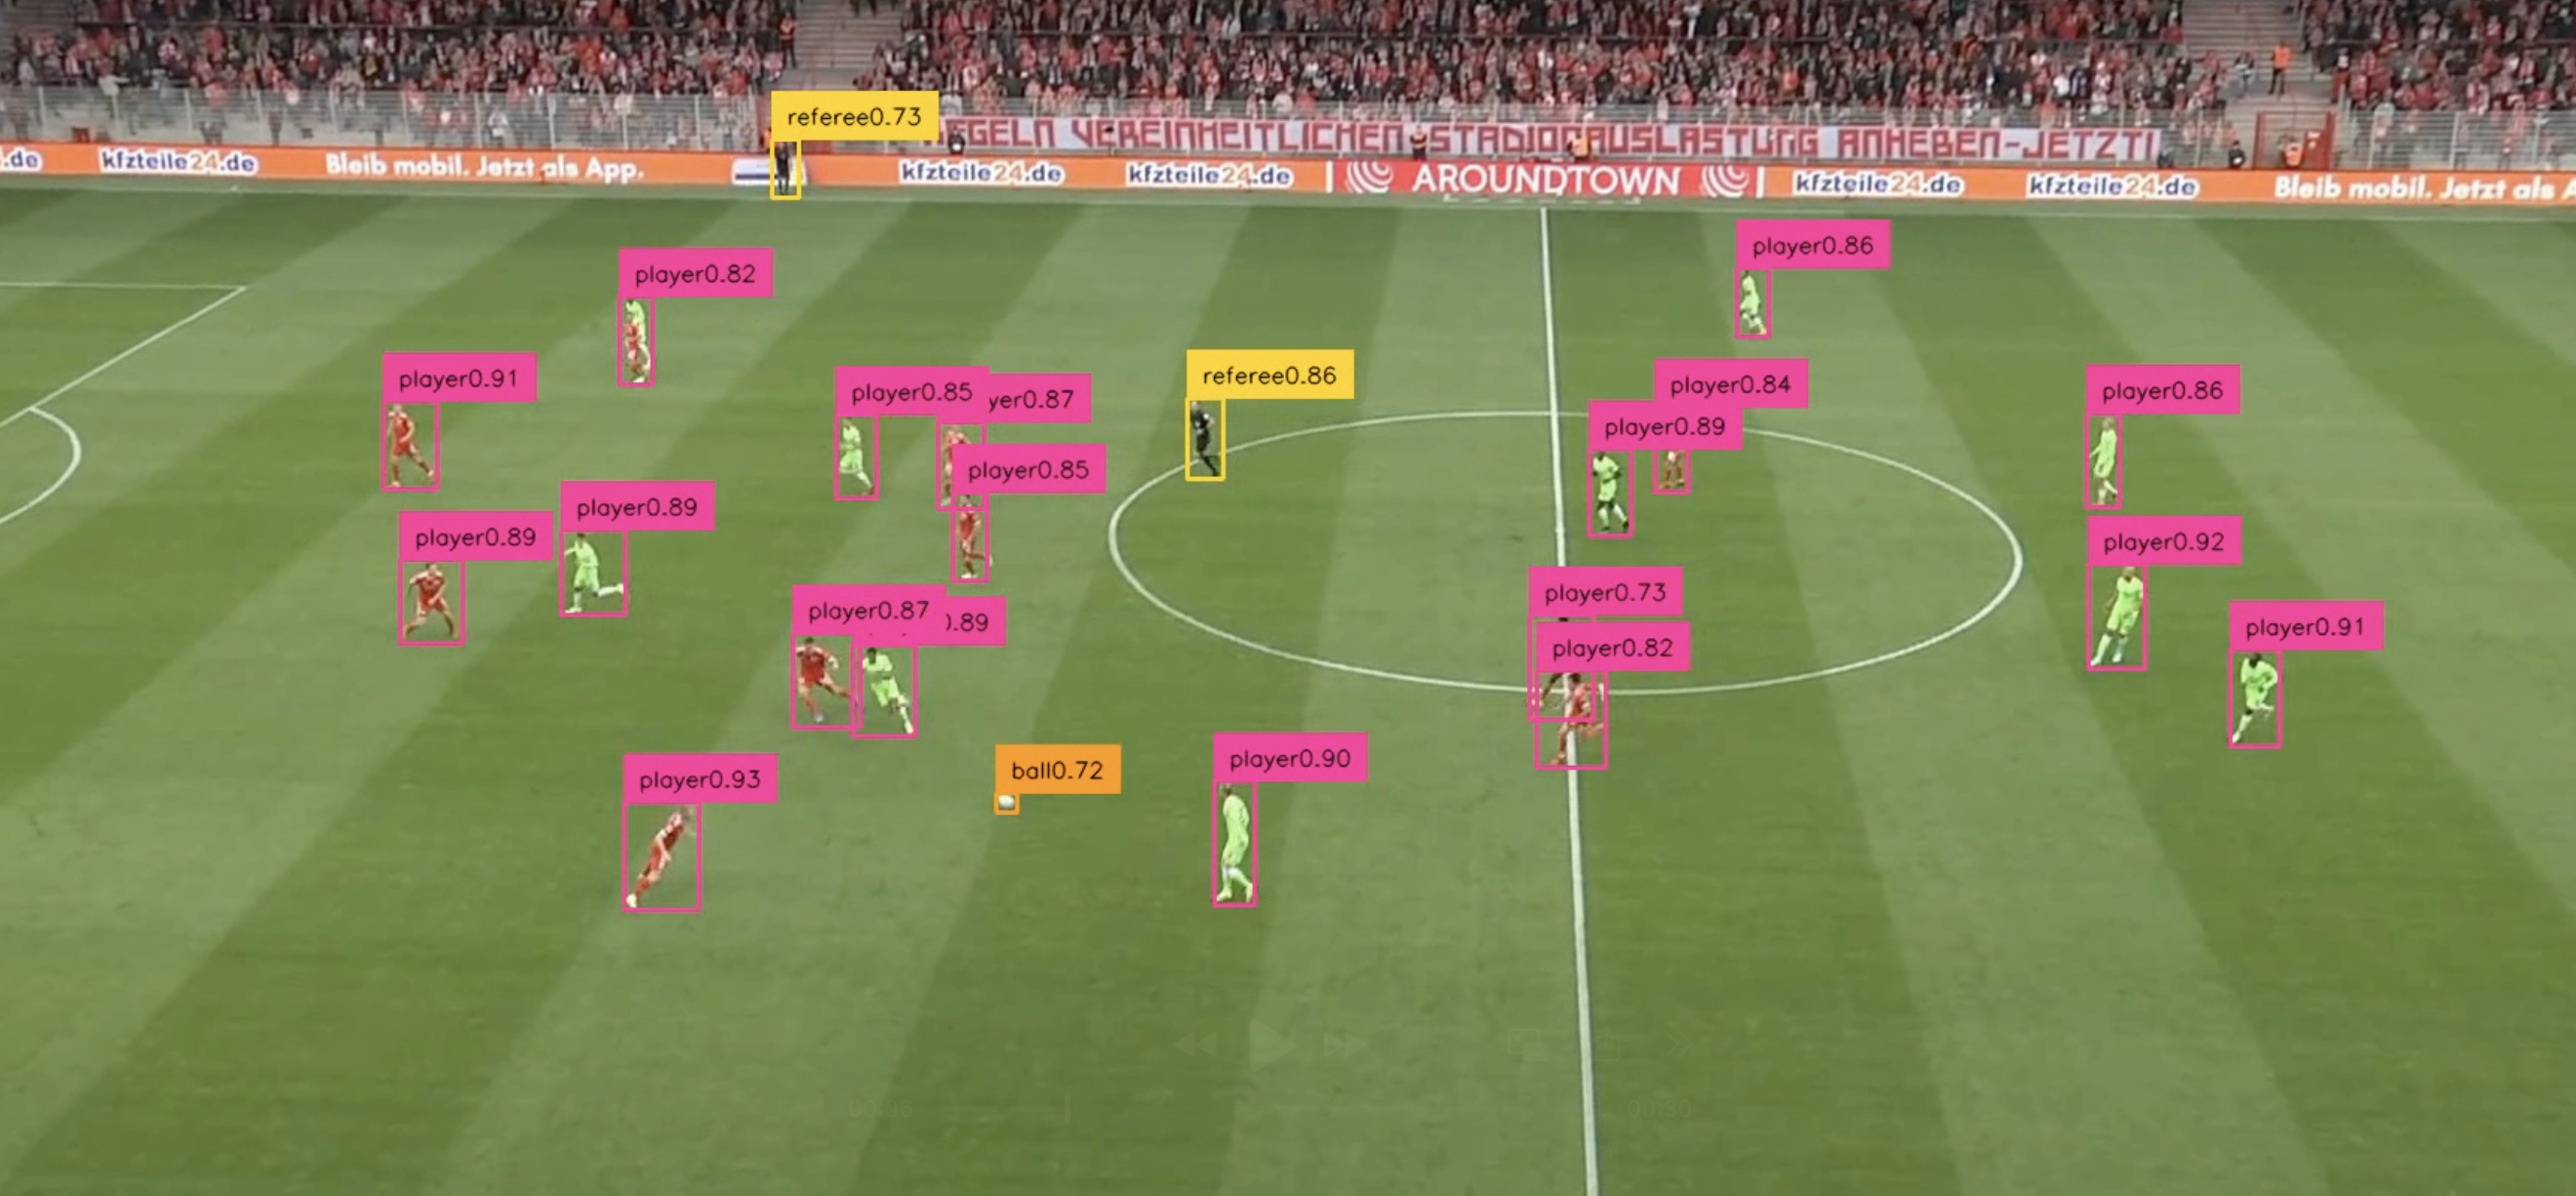
A Computer Vision Framework for Multi-Class Player Detection and Tracking in Soccer Broadcast Footage
Smart Soccer Insights
The use of artificial intelligence in soccer analytics is rapidly expanding, yet most professional tracking systems still rely on expensive multi-camera setups that limit accessibility for lower-resource teams. This paper investigates whether coordinate and event-level information can be reliably extracted from raw broadcast footage using a single-camera, computer vision based pipeline. In this paper we develop a system that combines a YOLO object detection model, a keypoint pitch detector, and the ByteTrack tracking algorithm to identify and track players, referees, goalkeepers, and the ball across match frames. The model was trained on a custom dataset containing professional broadcast footage as well as additional gameplay recordings. Results show that the pipeline achieves high performance in detecting players and on Oficials, with strong precision, recall, and mAP scores across most classes. Ball detection remains the primary challenge due to its small size, rapid movement, and frequent occlusion. Despite this limitation, the findings demonstrate that AI can reliably extract player-level spatial information from a single broadcast camera. This work highlights the potential for afordable, scalable computer vision systems in soccer analytics. By reducing the reliance on specialized hardware, the proposed approach opens the door for colleges, academies, and amateur clubs to adopt data-driven methods traditionally accessible only to professional teams.
- Created - December 2025
- Technologies - Python, OpenCV, YOLOv8, KMeans, PyTorch, multi-object tracking, key point detection, perspective transformations, Embeddings Analysis, SigLib, Classifications, scikit-learn, NumPy, pandas
- Role - Artificial Inteligence Engineer (Development Sports Analytics Lab)
- View - Click here for the full paper
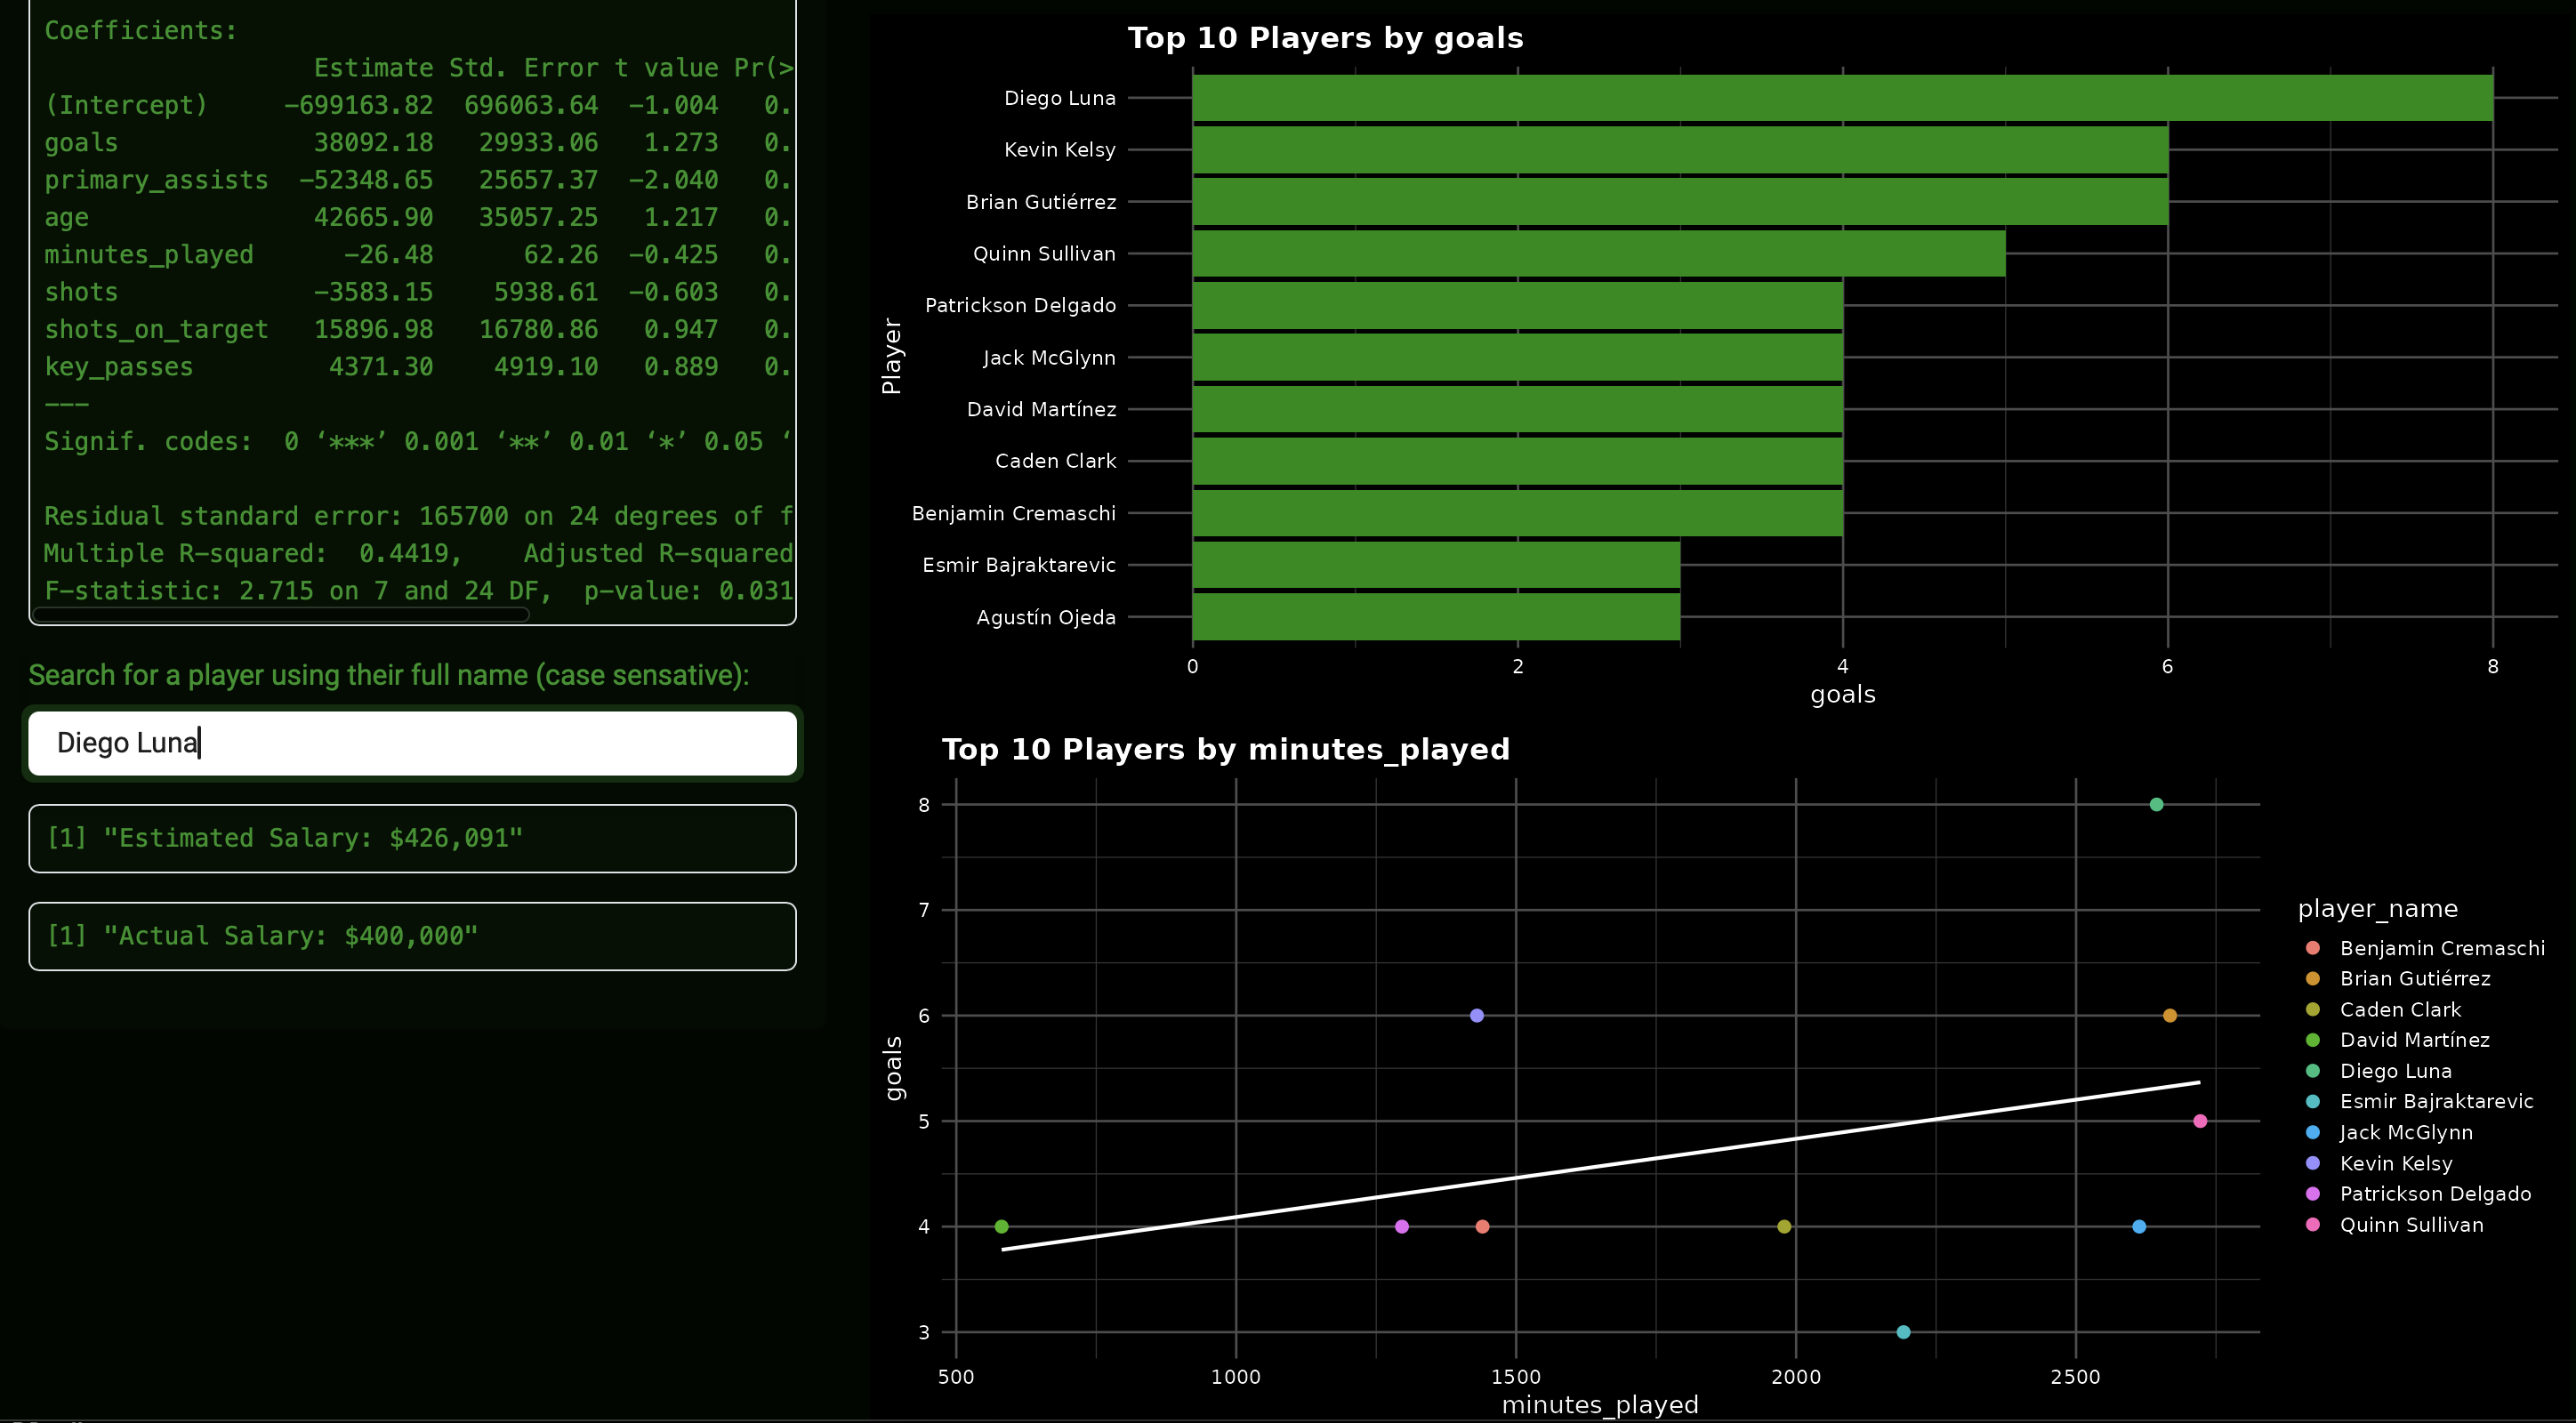
U.S. Soccer Player Analytics and Recruitment Dashboard
Player Performance Lab
Developed an interactive R Shiny application for soccer scouts, fans, and coaches to explore and facilitate player discovery. Integrated an external API to retrieve real-time player statistics, with filtering options for key performance indicators. The app generates custom visualizations of metrics such as goals, assists, and other offensive actions, and incorporates a regression model to estimate player salaries to determine if they are currently overpaid or underpaid. Designed to support data-driven recruitment decisions, the tool combines exploratory data analysis with predictive modeling in an accessible, user-friendly interface.
- Created - April 2025
- Technologies - R Studio
- Role - Data Scientist & Full-Stack Developer (Academic Project – American University)
- View - Click here for a live demo and scout your own players
DGT-International Portfolio Website
Designing and Developing a Personal Website
I designed and developed my personal portfolio website to showcase my data science, analytics, and web development work. Built with HTML, CSS, JavaScript, and TypeScript, the site features an interactive, filterable project gallery, responsive design, and integrations for downloadable resources. The goal was to create a clean, user-friendly platform that highlights both technical skills and professional experience while serving as a central hub for my projects and publications.
- Created - September 2025
- Technologies - HTML, CSS, JavaScript
- Role - Full-Stack Developer & Designer (Personal Project)
- View - Click here to...

Predicting Credit Card Approvals: A Machine Learning Study
Classification Models for Risk Assessment and Fair Decision-Making
Developed a machine learning workflow to predict credit card approval decisions using applicant data such as income, employment status, and credit history. Implemented data preprocessing, exploratory analysis, and multiple classification models including logistic regression, decision trees, random forests, and gradient boosting. Evaluated model performance with cross-validation, mean squared error, and test error rates, selecting the most accurate approach while addressing class imbalance and ensuring interpretability. Assessed fairness across sensitive attributes and examined the ethical implications of automated financial decision-making. Findings were presented in an informative session combining technical insights with practical recommendations.
- Completed - May 2025
- Technologies - R Studio
- Role - Data Scientist (Academic Project- American University)
- View - This project will be updated and published at a later date but get in touch with me to learn more if interested
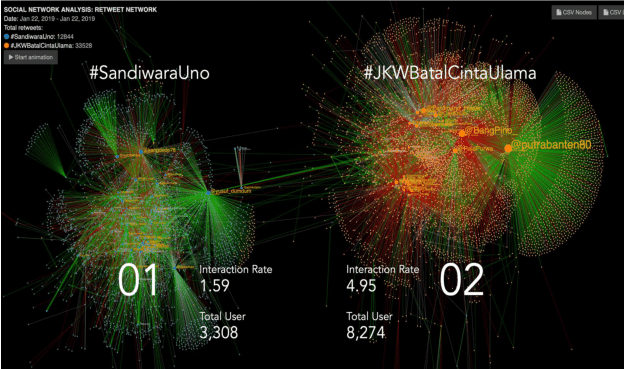
Networks of Influence and Support Between War and Peace
Interactive Network Visualization of Peacebuilding Actors and Relationships
Designed and developed an interactive web application to visualize international actor networks in fragile and conflict-affected states. Built using JavaScript, HTML, and the Cityscape.js library, the app allows users to toggle between datasets, countries, organization types, and sectors to explore the structure and dynamics of peacebuilding networks across regions. Responsible for website development, data preprocessing, and network visualization, I worked to highlight how formal contracts, informal relationships, and coordination meetings between international, state, and non-state actors relate to indicators of conflict and peace over time.
- Created - August 2025
- Technologies - HTML, JavaScript
- Role - Full-Stack Developer & Data Visualization Specialist (Research Implementation on International Policy Lab)
- View - Please reach out if you are interested in learning more about this project

Le Projet d’Appui à la Scolarisation des Filles Affectées par le Conflit (PASCOFI)
Evaluating Education Access for Conflict-Affected Girls in Mali
Contributed to the evaluation of PASCOFI, an initiative aimed at improving educational access and outcomes for girls affected by conflict in Mali. Supported data collection and analysis efforts to assess program effectiveness in increasing school enrollment, attendance, and retention. Responsibilities included cleaning and validating student and school-level data, generating summary statistics, and producing visualizations to communicate findings to project stakeholders. Collaborated with multilingual teams to ensure accurate interpretation of context-specific education indicators and to inform recommendations for scaling program interventions in conflict-affected regions.
- Contributed - July 2025
- Technologies - STATA, Excel
- Role - Education Data Analyst (American Institutes for Research)
- View - Please reach out if you are interested in learning more about this project
Citizen Math Impact Evaluation
Assessing Middle School Math Outcomes through Mixed-Methods Evaluation
Contributed to a U.S. Department of Education–funded evaluation of Citizens Math lessons in middle school classrooms, conducted by the American Institutes for Research as a subcontractor to WestEd. The project assessed the program’s impact on students’ math skills and perceptions of the subject. My responsibilities included tracking participating schools, automating the extraction and processing of district administrative records, and cleaning and analyzing student and teacher survey data, managing communications with district coordinators and school representatives, and conducting preliminary quality checks.
- Contributed - July 2025
- Technologies - R Studio, STATA, and Excel
- Role - Education Data Analyst (American Institutes for Research for U.S. Department of Education, subcontracted to WestEd)
- View - Please reach out if you are interested in learning more about this project

Strengthening Teacher Professional Development for Multilingual Foundational Learning at Scale
Randomized Controlled Trial Evaluation in Côte d’Ivoire, Democratic Republic of Congo, and Senegal
As part of an IDRC-funded partnership between the American Institutes for Research and Dalberg, I contributed to a large-scale randomized controlled trial evaluating the impact of FLIP programming on multilingual foundational learning. My work included designing quantitative research instruments, collecting data through teacher surveys, student assessments, and classroom observations, and analyzing teacher and student outcomes using OLS regression with covariates for precision. I supported sample selection, power calculations, and the adaptation of validated tools to measure educational outcomes in multilingual contexts. I also drafted sections of the inception report and actively participated in multilingual (English/French) team meetings to ensure effective collaboration.
- Contributed - July 2025
- Technologies - STATA, Excel
- Role - Education Data Analyst (American Institutes for Research for IDRC in partnership with Dalberg)
- View - Click here to learn more on GPEKIX's website

Promoting Autonomy for Literacy and Attentiveness through Market Alliances
Midline Evaluation of Literacy, Health, and Nutrition Outcomes through a Randomized Controlled Trial
As part of a mixed-methods evaluation for Save the Children and the American Institutes for Research, I contributed to assessing the PALAM/A program’s impact on student literacy, health, and nutrition in Sri Lanka. My work included analyzing literacy assessments, health and nutrition surveys, and school meal provider cost surveys. I quantified changes in outcomes using randomized controlled trial data, providing evidence to inform program effectiveness and policy decisions.
- Contributed - August 2024
- Technologies - STATA, Microsoft Excel
- Role - Quantitative Research Assistant (American Institute for Research for Save the Children)
- View - Click here to view the full report USAID's website

24/7 Access Makes the Difference: After-Hours Access to Emergency Departments is Critical in Supporting Patients and Communities
Analyzing Patterns in Emergency Care Access and Utilization
This project analyzed 2021 U.S. hospital emergency department (ED) visit data to understand patterns in after-hours utilization. The findings showed that nearly half of ED visits occur between 5 p.m. and 8 a.m., when other care options are limited. The analysis highlighted higher after-hours usage among pediatric patients, rural populations, and those experiencing trauma, overdose, or poisoning. Insights from this study supported policy discussions on the importance of maintaining 24/7 hospital access, especially as other healthcare sites close during off-hours.
- Completed - July 2024
- Technologies - STATA, Microsoft Excel
- Role - Health Data Analyst (KNG Health Consulting for the Coalition to Strengthen America's Healthcare)
- View - Click here to view blog and full report on the Coalitions's website
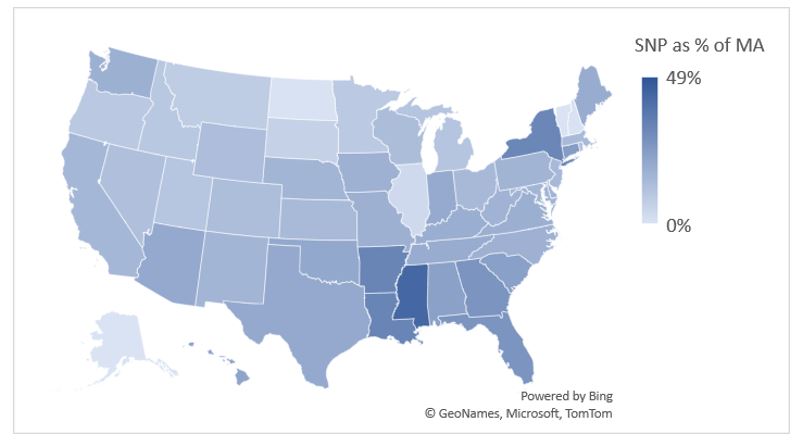
Growth in Special Needs Plans Outpaces that of Medicare Advantage, Particularly in the South
Analyzing Trends in Medicare Advantage Special Needs Plans (SNPs)
This project examines the rapid growth of Medicare Advantage Special Needs Plans (SNPs) between 2021 and 2023, with a focus on geographic variation and enrollment patterns. Using CMS enrollment data, I analyzed relationships between SNP penetration, Medicare Advantage (MA) enrollment, and regional trends—finding particularly strong growth in Southern states. The analysis included correlation calculations, percentage change tracking, and data visualization to highlight key patterns and disparities in access to coordinated care for high-need populations.
- Published - May 2024
- Technologies - STATA, Microsoft Excel
- Role - Health Data Analyst
- View - Click here to view blog on KNG's website
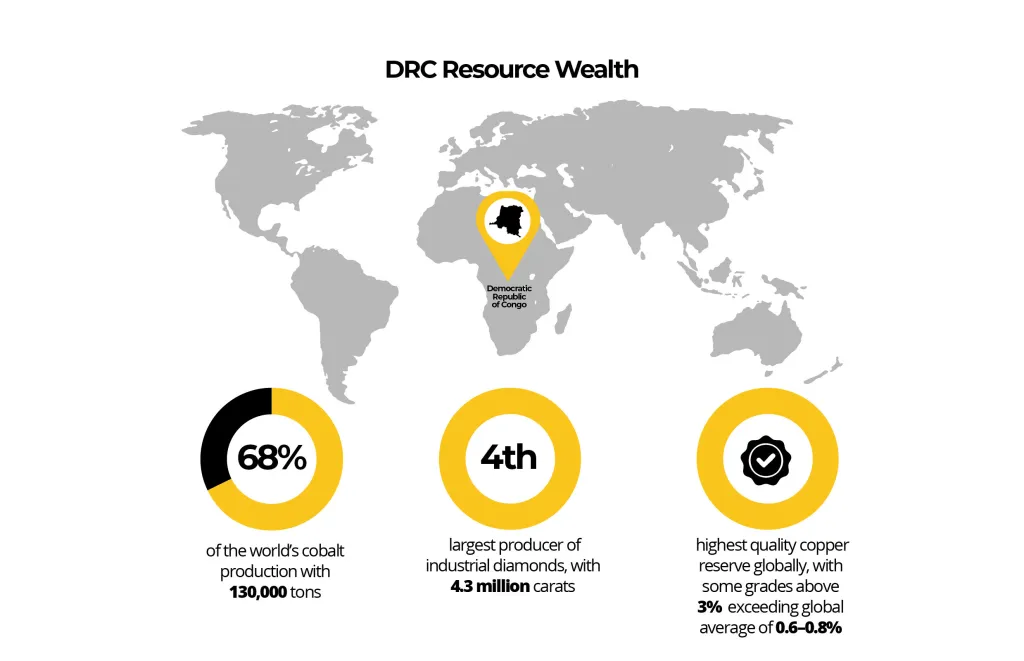
The Resource Curse: Economic Complexity in the Democratic Republic of Congo
Analyzing the Impact of Natural Resource Dependence on Economic Development
This early academic project explored the relationship between the Democratic Republic of Congo’s abundant natural resources and its economic performance through the lens of the Economic Complexity Index. Using trade and economic data, the analysis examined how reliance on raw resource exports can hinder diversification and long-term growth. The project provided foundational experience in economic research, data interpretation, and presenting policy-relevant findings.
- Completed - May 2024
- Technologies - STATA, Microsoft Excel
- Role - Author & Data Scientist (Academic Project - American University)
- View - This project has been archived. It will be revisited at a later date but click here to contact me if you want to know more about this project.
App for technology & services
Lorem ipsum dolor sit amet consectetur adipisicing elit. Quisquam, voluptatum. I WILL COME BACK TO THIS LATER.
- Created - 4 dec 2020
- Technologies - HTML CSS
- Role - frontend
- View - www.domain.com